Setting the date range
At the top of the Manager tab, controls let you define the time period for all the data shown below.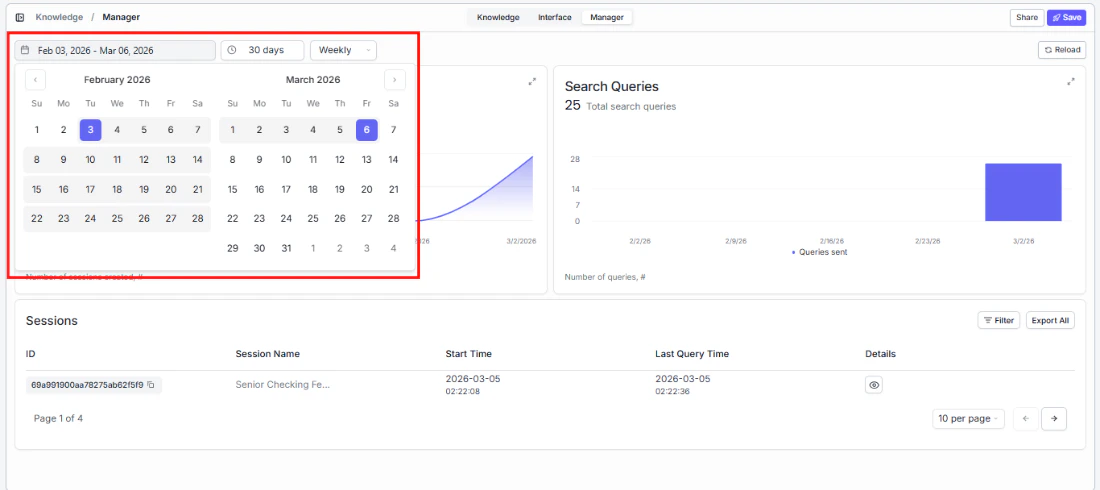
Aggregation
A dropdown to the right of the presets lets you choose how data is grouped on the charts (e.g., Weekly).
Reload
Click the Reload button in the top-right corner to refresh the data with the latest numbers.
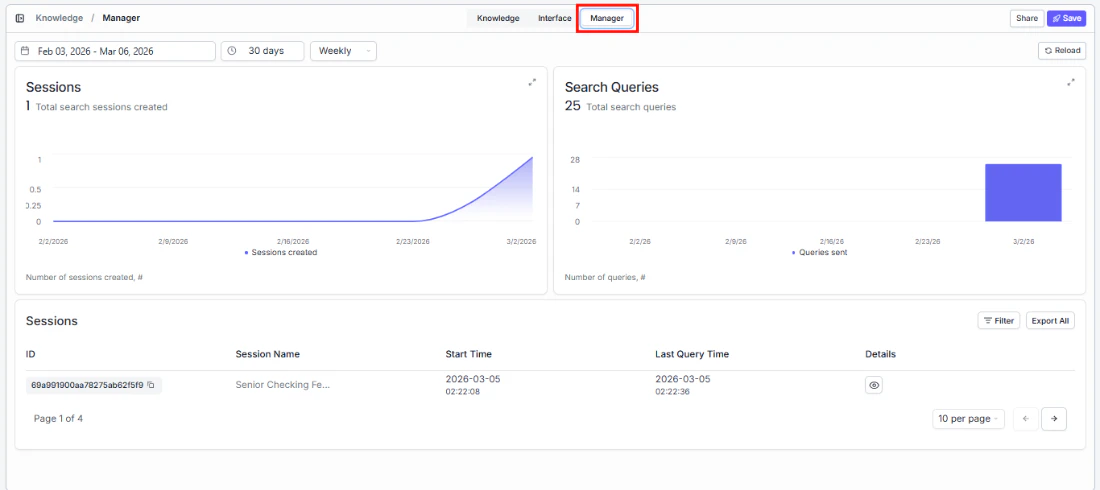
Sessions and search queries metrics
Two charts give you a clear picture of adoption and engagement: Sessions Track how many people are using your search over time. The total count appears at the top. Click the expand icon to see trends in more detail. Search Queries Understand search volume — how many questions are being asked. A single session can contain multiple queries, so this metric shows overall engagement depth. Click the expand icon to enlarge.Sessions table
Drill into individual sessions to see what users searched for and when — useful for identifying common questions and content gaps:- Filter: Narrow the sessions list by specific criteria.
- Export All: Download the full sessions data for analysis.
- Pagination: Navigate between pages using the arrow buttons. You can also change how many sessions appear per page (e.g., 10 per page).