Use this node from the SDK
Add it in Python with
pipeline.add(name="...").get_run_data(...). See the SDK reference.Core Functionality
- Fetches aggregated run metrics for a session by session ID
- Returns performance data: total latency, token usage, API cost, cache hit rates
- Returns execution status: success, failure, in_progress, or not_found
- Provides timing information: start time, end time, and trace ID for debugging
Tool Inputs
Session ID* — Text. Required. The session ID (execution_id) to fetch run metrics for.
Tool Outputs
tokens— Integer. Total tokens across all spans in the session.avg_api_latency— Decimal. Average API latency across LLM spans in seconds.avg_cache_hit_rate— Decimal. Average cache hit rate across LLM spans (0.0 to 1.0).total_ai_cost— Decimal. Total AI credits/cost across spans.status— Text. Aggregated status of the run (success, failure, in_progress, not_found).status_message— Text. Last status message from the run, if any.trace_id— Text. Trace ID associated with this session run.total_latency— Integer. Total latency in nanoseconds.start_time— Text. Earliest span start time.end_time— Text. Latest span end time.total_cache_savings— Decimal. Total cache savings across LLM spans.total_cached_tokens— Integer. Total cached tokens across LLM spans.
- Workflows
Overview
In workflows, the Get Run Data node connects to a session (via session ID) and retrieves performance and execution metrics. Use it after running an agent session to check costs, latency, token usage, and completion status. This enables monitoring workflows, cost tracking dashboards, and conditional logic based on execution results.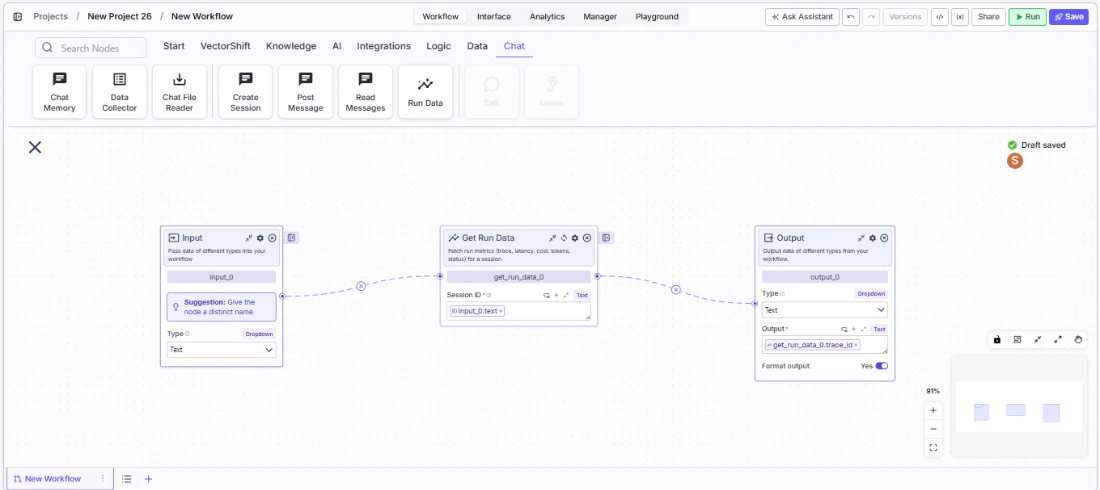
Use Cases
- Track total AI cost per session to monitor spending against budget thresholds and trigger alerts when costs exceed limits
- Check session status after running an automated analysis to verify completion before sending results to stakeholders
- Measure average API latency across sessions to monitor SLA compliance for customer-facing chatbots
- Calculate cache hit rates to evaluate prompt caching effectiveness and optimize for cost savings
- Log trace IDs and timing data for debugging failed or slow-running agent sessions
How It Works
Step 1: Add the Get Run Data Node
In the workflow canvas, click the Chat tab and click Run Data.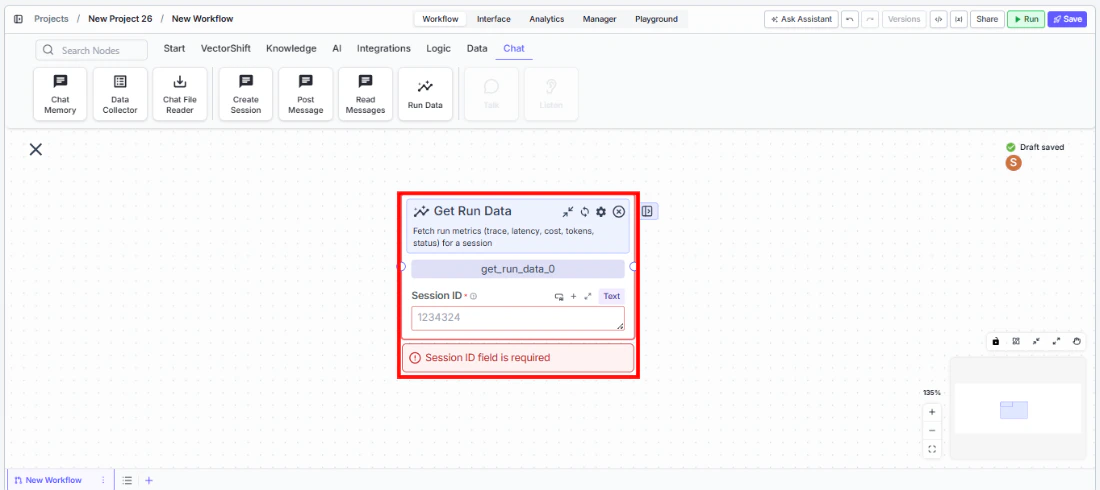
Step 2: Connect the Session ID
Connect theSession ID input from an upstream Create Session or other node that provides a session/execution ID.Step 3: Connect Outputs
Connect the relevant metric outputs to downstream nodes. For example, connectstatus to a condition node to branch on success/failure, or connect total_ai_cost to a notification node for cost alerts.Step 4: Test
Run the workflow and verify that metrics are returned correctly for the specified session.Settings
| Setting | Type | Default | Description |
|---|---|---|---|
Session ID | Text | — | The session/execution ID. Required. |
Show Success/Failure Outputs | Toggle | Off | Show additional output handles. Advanced setting. |
Best Practices
- Use for cost monitoring. Connect
total_ai_costto threshold checks and notifications to prevent runaway spending. - Check status before proceeding. Route the
statusoutput to a condition node to ensure the session completed successfully before acting on its results. - Log metrics for analytics. Store trace IDs, latency, and token counts for long-term performance analysis and optimization.
- Monitor cache effectiveness. Track
avg_cache_hit_rateandtotal_cache_savingsto measure the impact of prompt caching strategies. - Pair with Create Session and Post Message. The full pattern is: Create Session → Post Message → Get Run Data to orchestrate and then measure agent interactions.
Related Templates
Customer Support Chatbot
Handles common customer inquiries and support tickets through conversational AI.
Banking Helpdesk
Assists banking customers with account inquiries, transactions, and product questions.
CRM Insights Digest Agent
Summarizes and surfaces key CRM data insights for sales and relationship management teams.
Investor Helpdesk
Handles investor inquiries related to portfolios, statements, and fund performance.