The Manager tab gives you visibility into how your Agent is being used — track adoption trends, spot issues, and review individual conversations. Manager tab overview

Date and time controls

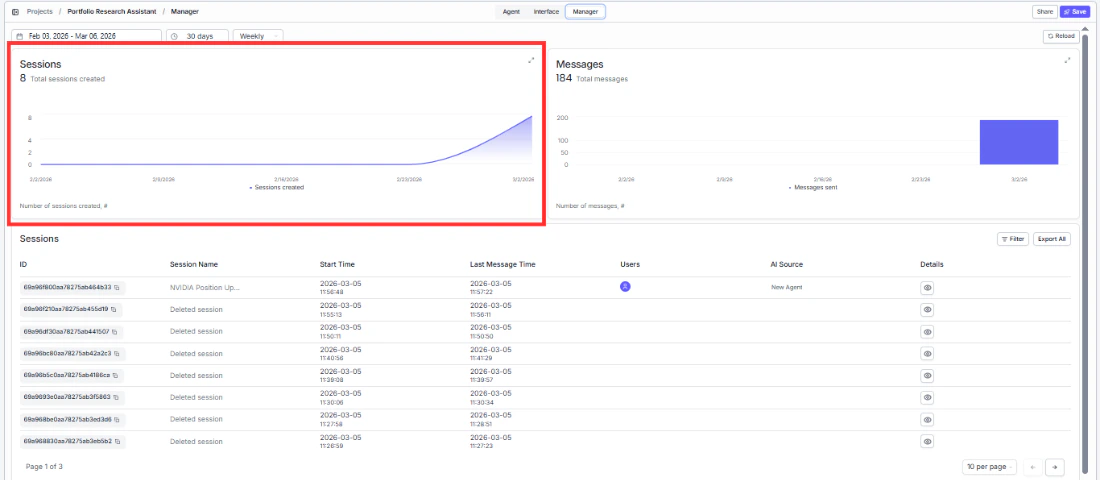
Filter analytics by date range, duration preset (e.g., 30 days), and frequency (e.g., Weekly) to focus on the time period that matters.

Analytics charts

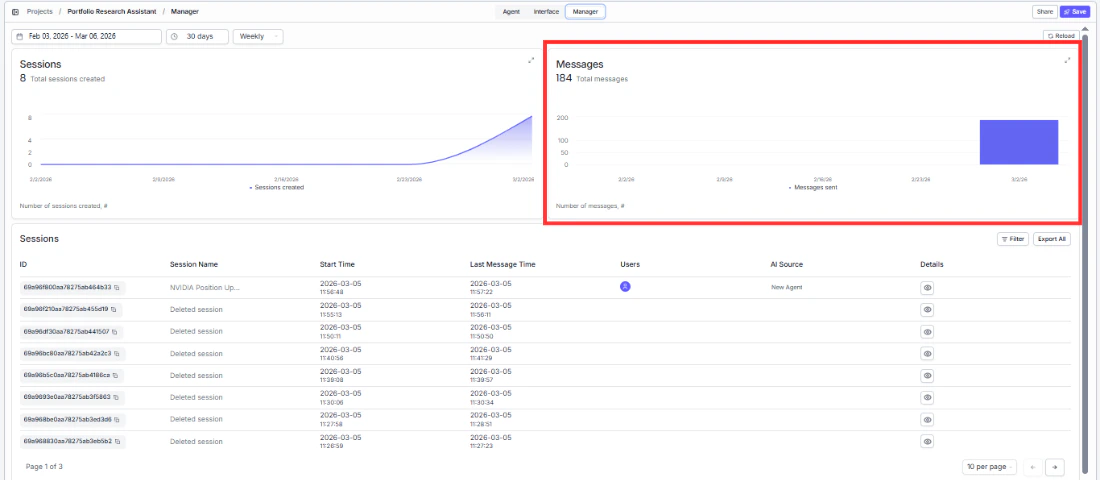
Two charts give you a quick pulse on usage:
  • Sessions — see how many conversations are being started over time.
  • Messages — track total message volume to understand engagement depth.
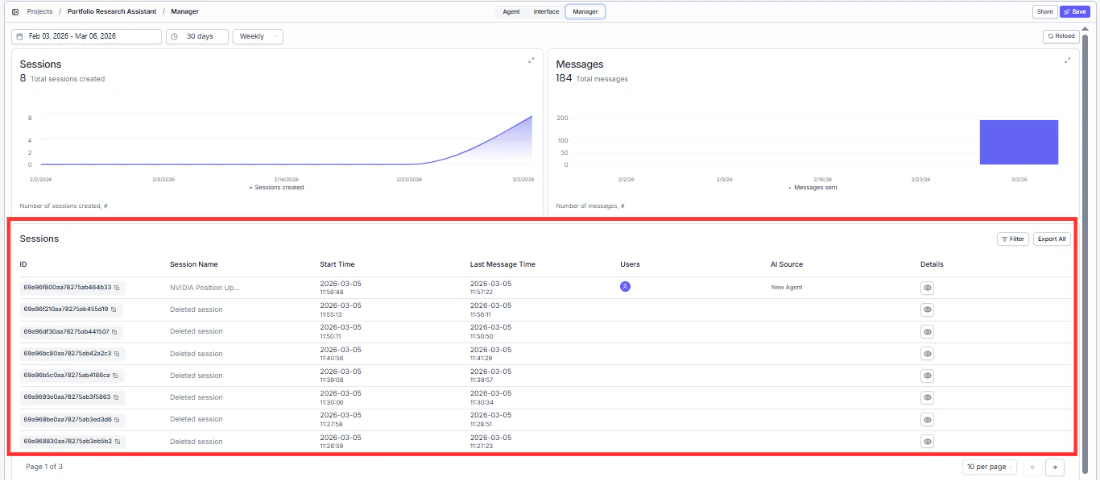
Sessions analytics chart Messages analytics chart

Sessions table

Drill into individual conversations to understand what users are asking and how your Agent is responding. Sessions table Each session shows the session ID, name, start time, last message time, participating users, AI model used, and a link to view the full conversation log. Use the Filter button to narrow results or Export All to download session data for deeper analysis.