Filters and time range
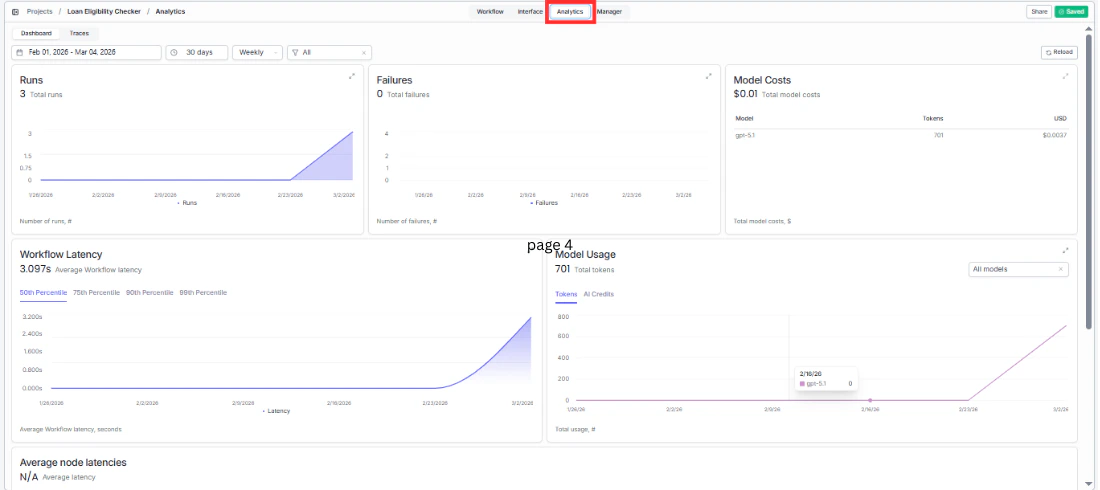
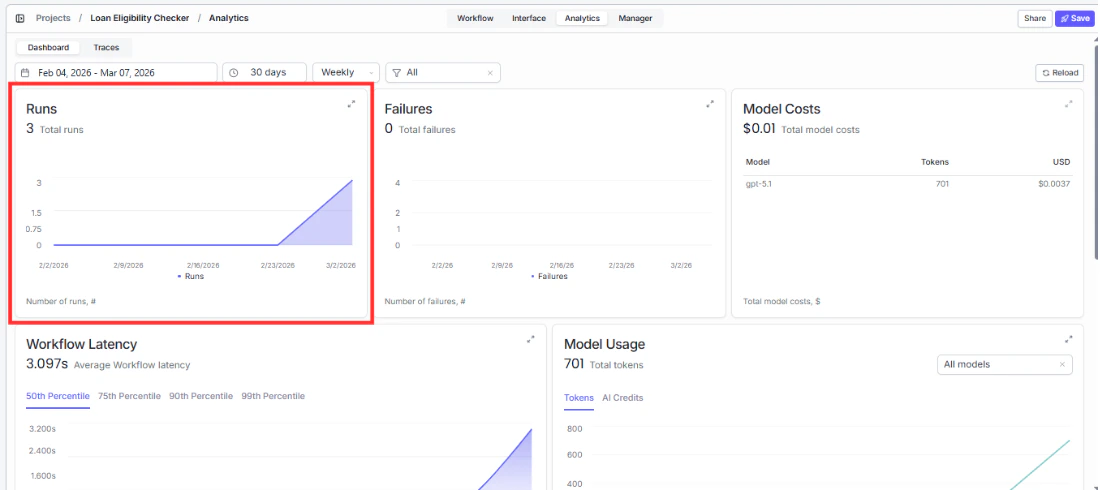
At the top of the Analytics page you will find the controls for filtering what you see. The date range picker on the left defaults to the last 30 days. Click it to open a calendar and set a custom start and end date. The time period dropdown next to it gives you quick preset ranges instead of picking dates manually. The Weekly/Monthly toggle controls how data is grouped in the charts. Weekly shows a data point for each week in your selected range. Monthly groups it by month. Switch between them depending on whether you are looking at recent trends or longer patterns. Click Reload in the top right corner any time you want to make sure you are seeing the most current data.Runs
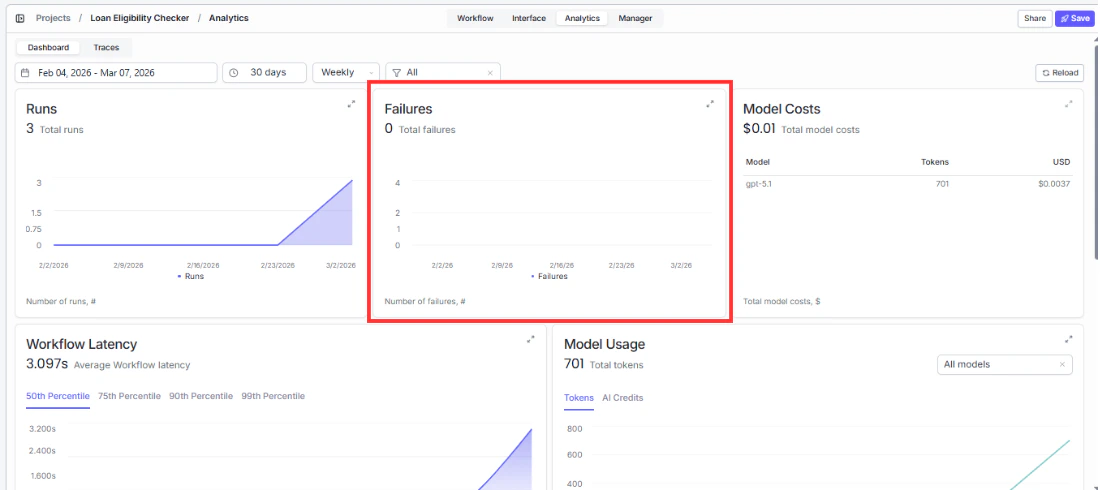
Failures
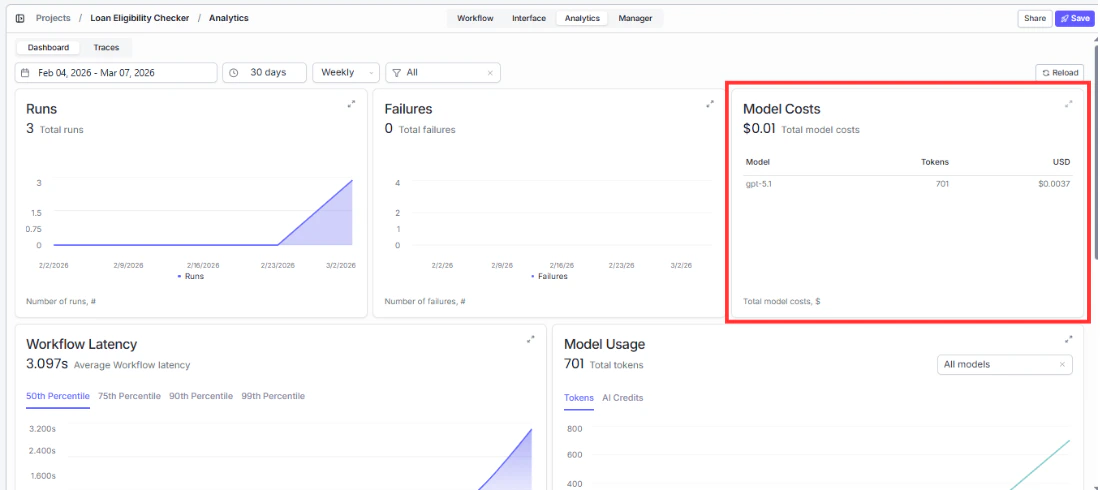
Model costs